Remote Sensing
Author: Arnold Nagy, Central European University (Budapest, Hungary)
INTRODUCTION
Remote Sensing encompasses a range of technologies and tools which capture/analyze the energy that is reflected from Earth. Sensors are mounted either on satellites or aircraft, and can be passive (capturing energy that is naturally available; e.g. satellite-based optical sensors) or active (providing their own energy for illumination, then detecting and measuring the reflected energy; e.g. Synthetic Aperture Radar / SAR and Light Detection and Ranging / LiDAR).
Remote sensing data is particularly useful for water management and water security practitioners. Remote sensors can detect variations in hydro-meteorological variables with a comparatively high temporal resolution, making them ideal for water resource assessment. At the same time, high resolution data can provide critical information on flood and drought events.
Applications of remote sensing for water resources include:
- Rainfall-runoff studies
- Drought monitoring
- Flood forecasting
- Irrigation management
- Rain water harvesting
- Watershed planning and management
- Groundwater studies
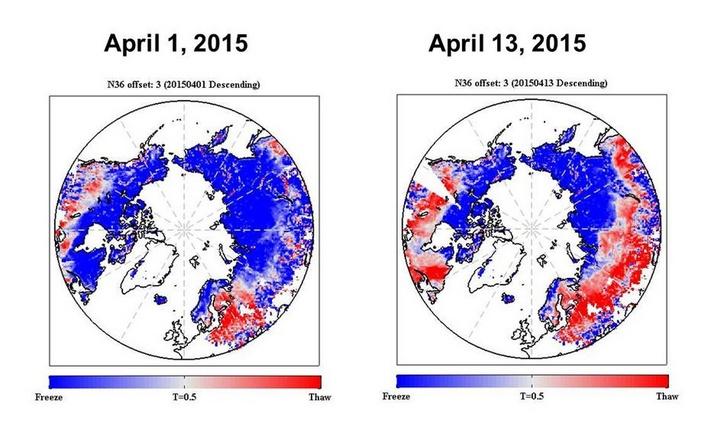
Figure 1. Spring thaw progression revealed by NASA’s SMAP (Soil Moisture Active Passive) satellite. Source: http://smap.jpl.nasa.gov/resources/85/
TECHNOLOGY NOTES:
- Global / large-scale databases with remote-sensing data represent the single most valuable source of information in areas with limited in-situ data, a common scenario in water management and water resource assessment. The availability and development of remote sensing data/tools have reshaped the work of environmental practitioners worldwide; their importance cannot be overstated.
- The combination of flexibility, coverage (e.g. global datasets from satellite-based sensors) and accuracy (particularly in the case of some active sensors mounted on aircraft – see LiDAR) makes remote sensing an invaluable component of most environmental planning efforts, irrespective of other available information.
- When in-situ data is available (e.g. water quality measurements in a river basin), remote sensing data is often used in data modelling to aid in the interpolation of existing information and to identify spatial/temporal patterns.
- Environmental practitioners typically use validated, pre-processed remote sensing data which can readily be managed, visualized and analyzed using GIS tools.
USING/INTEGRATING REMOTE SENSING DATA
Water resources management makes use of remote sensing data in two typical operational scenarios:
- Remote sensing data is used to bridge data gaps in ground observations. When the latter are central to our information/research needs, remote sensing data can provide additional data points, which can be integrated and analyzed together with ground observations, often with the aid of computer models. The World Bank infographic in Figure 2 provides an overall context for this integration, listing the advantages and disadvantages of the two (typically) primary sources of information in water management: in-situ observations and remote sensing.
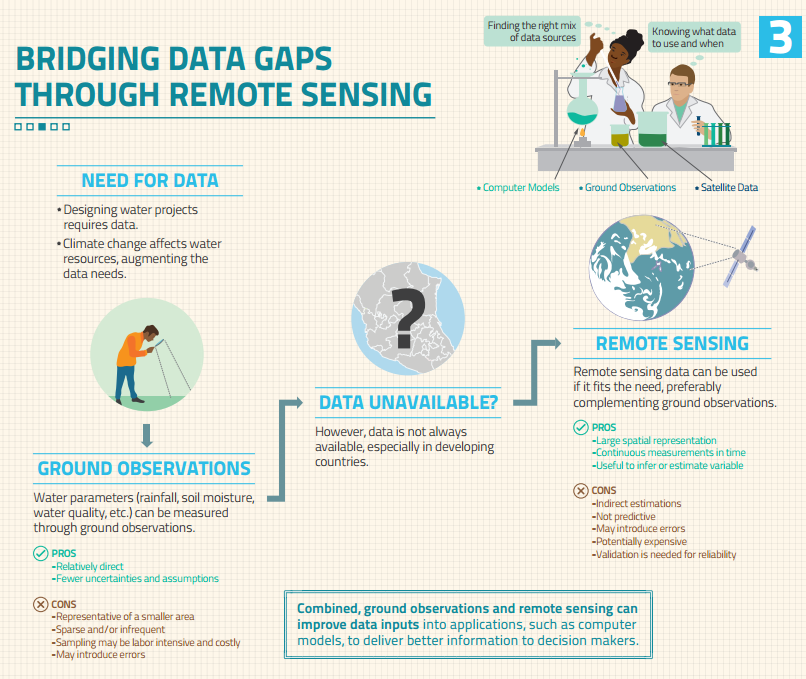
Figure 2. Bridging data gaps through remote sensing. Source: http://water.worldbank.org/sites/water.worldbank.org/files/WPP-Infograph...
- Remote sensing data is the primary (or the only) source of information. This is the case when ground observations are unavailable, unreliable, or they are insufficient for the spatial and temporal coverage/resolution of the analytical framework employed. Large-scale studies in countries/regions where in-situ data is typically insufficient often have to rely exclusively on remote sensing data. Following its retrieval, raw data is verified and processed into direct and assimilated hydro-meteorological variables, which are then integrated into the modelling framework, for the analysis of patterns and trends. The flowchart in Figure 3 gives an example of such a process, a dynamic water balance model of key hydrological processes in drylands, which is based on free remote sensing data available in the public domain (Tarnavsky et al. 2013).
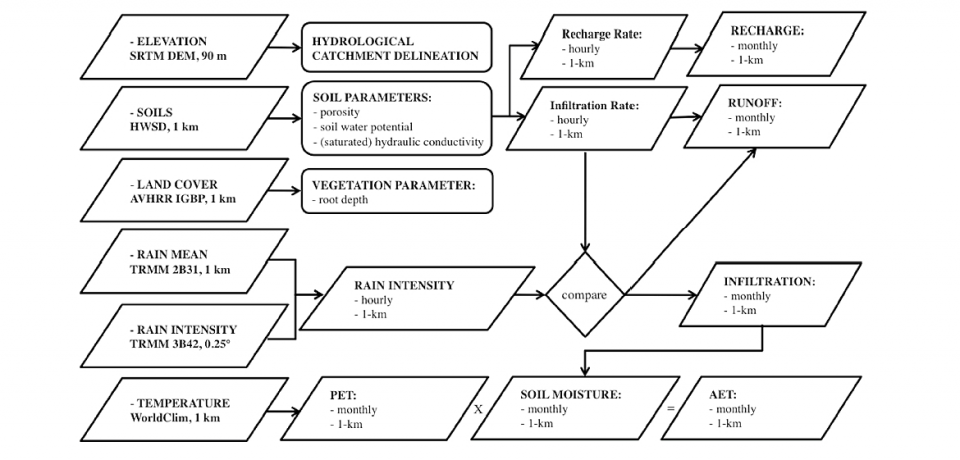
Figure 3. The DryMOD model: inputs and outputs (parallelograms), parameters (rectangles), and decisions (diamond shape). PET/AET = potential/actual evapotranspiration. Source: Tarnavsky et al. 2013.
REMOTE SENSING DATA FOR WATER MANAGEMENT: THE EXAMPLE OF NASA
If adequate and reliable ground observations are often still difficult to obtain, we can safely say that there has never been a better time for accessing high-quality remote sensing data of tremendous value for scientists, managers and decision-makers alike. As a leading contributor to Earth observation data repositories with global coverage, NASA (the National Aeronautics and Space Administration) has launched, over the last decades, a series of satellite missions which provide essential data for the assessment of water resources, available to practitioners worldwide through the data portals of the organization and its partners.
Some of the key NASA satellite missions generating information on water quantities are:
- Landsat (1972 – present)
- TRMM (Tropical Rainfall Measuring Mission)
- Terra
- Aqua
- GRACE (Gravity Recovery and Climate Experiment)
- GPM (Global Precipitation Measurements system)
- SMAP (Soil Moisture Active Passive); launched in 2015
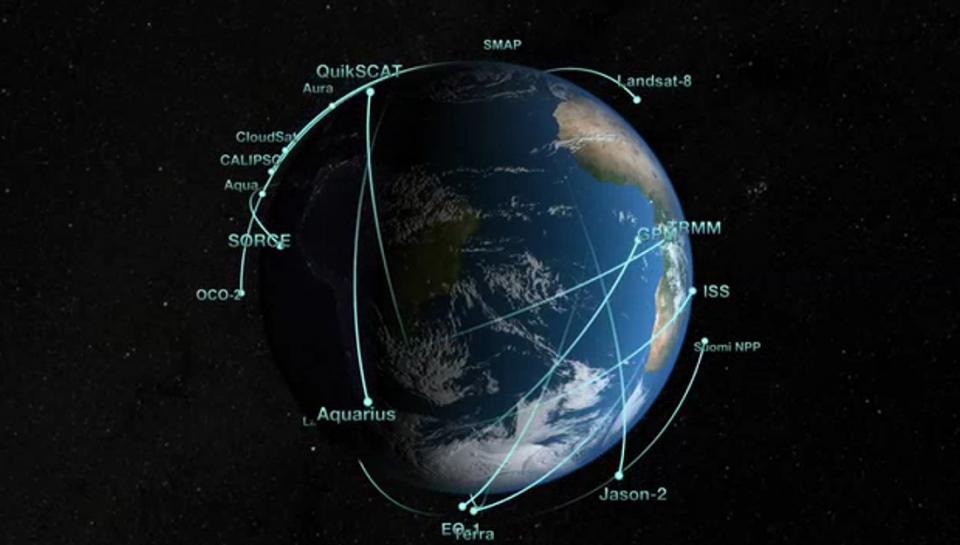
Figure 4. NASA Earth Observing Fleet (February 2015). Source: https://svs.gsfc.nasa.gov/cgi-bin/details.cgi?aid=4274
Global scale water cycle quantities are provided by NASA’s satellite missions on hourly, daily, seasonal and multi-year timescales. This way, they can be used in water resources assessment, flood and drought monitoring and management, and a variety of other water management applications.
Parameters/variables of critical interest for water management and water security specialists are generated either directly from remote-sensing data, or through modelling within atmosphere-ocean-land models. NASA has developed several such models (e.g. GEOS: The Goddard Earth Observing System, MERRA: Modern Era Retrospective Analysis for Research and Application, GLDAS: Global Land Data Assimilation System).
Some quantitative variables are available from both satellite observations and models (in which satellite observations are assimilated):
- Rain
- Temperature
- Humidity
- Soil Moisture
- Wind
- Snow/Ice
- Clouds
Some are derived from satellite observations:
- Terrain
- Ground water
- Vegetation Index
Others are derived from land or atmosphere-land models:
- Evapotranspiration
- Runoff
NASA’s Applied Remote Sensing Training program (ARSET) provides information and training materials in support of key applications of remote sensing data, including a dedicated section for water (http://arset.gsfc.nasa.gov/water). Users can registers for water webinars and water workshops focused on understanding, using and integrating remote-sensing data for water resources management. Information on available resources for the topic group is also provided (e.g. Table 1 groups together key characteristics of NASA’s precipitation products). Additional resources are provided by NASA’s Applied Sciences Program dedicated to Water Resources (https://c3.nasa.gov/water/).
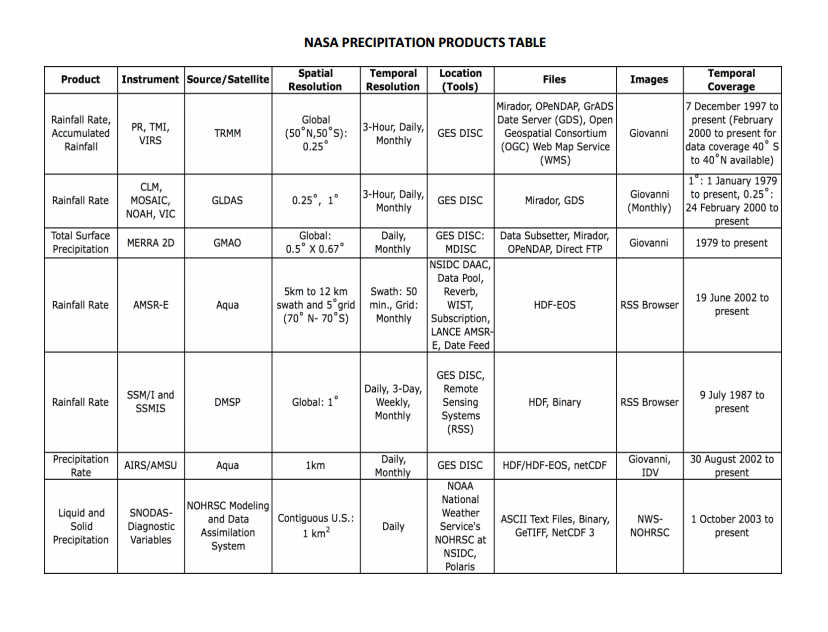
Table 1. NASA precipitation products table. Source: NASA’s ARSET program (http://arset.gsfc.nasa.gov/water)
REFERENCES
Tarnavsky, E., M. Mulligan, M. Ouessar, A. Faye and E. Black, 2013. Dynamic hydrological modeling in drylands with TRMM based rainfall, Remote Sensing, 5 (12), 6691-6716, 2013.